The essential building blocks of a VC fund model - Part 3
by David Cruz e Silva, an operator turned angel LP and founder of eu.vc and Marc Penkala General Partner at āltitude
If you haven’t read the first parts of this series, you can do it here: Part 1 & Part 2.
Distribution Waterfall
This is where the two key pillars- portfolio construction and decomposition- come together. Your fund’s distribution waterfall and carried interest structure aren’t just technical details; they define how value flows and who gets what once liquidity events hit.
There are plenty of ways to structure your distribution waterfall, but today we’re covering the two we love most: liquidation preference (over hurdle rates) and tiered carry (over flat carry).
Tiered Carry: A System That Works Both Ways
Carry shouldn’t be a one-way street. If a GP underperforms, why should they walk away with the same rewards as someone who crushed it? That’s where tiering comes in- it’s the fairest way to align GP and LP interests.
Here’s how it works:
If you underperform, your carry takes a hit.
If you hit the average, you get the standard cut.
If you overdeliver, you get rewarded accordingly (super carry).
Simple. Transparent. And, most importantly, it pushes everyone to aim higher. Model out all possible carry scenarios, but base your final structure on the average.
Liquidation Preference vs. Hurdle Rate: The Big Question
Now, let’s talk liquidation preference versus hurdle rate. The hurdle rate isn’t just a number- it’s an economic lever that starts at year one and doesn’t stop until full fund divestment or until the principal is repaid.
Example:
You’re a GP. It’s year 6, and you have a shot at divesting an asset. If you return the full principal amount, you’re no longer on the hook for a hurdle rate. That means you could:
✅ Sell now → Avoid paying the hurdle rate and take home carry earlier..
✅ Hold longer → Let the asset mature, potentially delivering a much bigger return for both GPs and LPs.
So, should you be indifferent when selling? Should you favor liquidation preference
If you want the answer to this question, real model examples, and an expert breakdown of this decision, subscribe to the community and watch the full masterclass - where we break it all down with data-driven precision.
The Fund Dashboard
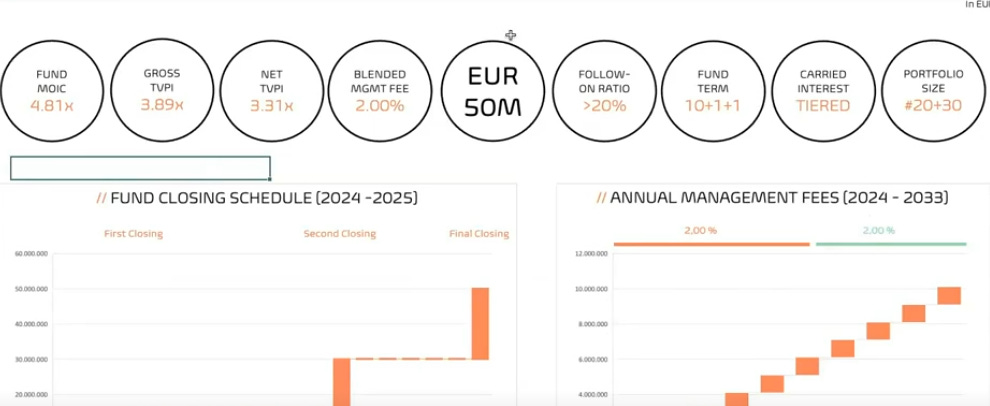
Your fund dashboard is your go-to place: the place where complex data gets distilled into visuals that make your LPs nod in understanding and, more importantly, in confidence.
Do keep in mind though: It’s not just about the data; it’s about making it impossible to misunderstand your fund’s performance and trajectory.
Bring your dashboard to life:
Picture this: a pie chart slicing your portfolio sectors, a line graph mapping drawdowns, cash flows and returns, and tables shining a spotlight on your core KPIs like TVPI, DPI, IRR and RVPI.
These visuals aren’t just for show; they turn complexity into clarity. A strong dashboard isn’t just informative- it’s intuitive. It builds trust with your LPs and positions you as someone who knows the game inside and out.
Be ready to face the fire- Your LPs are going to ask the hard questions, so own your answers:
What’s the closing schedule?
How are you raising the capital?
How do your fees evolve as the fund matures?
Why this entry strategy at this specific stage?
What’s your rationale for these fee structures?
How does your follow-on strategy guarantee a boost in returns?
Do you have a recycling strategy in place?
Every decision needs to be rock-solid. Show LPs the why behind every move: the fund size, the allocation for follow-ons versus initial entries, and how fees develop over the fund’s lifetime.
Add a crystal-clear distribution plan:
Your dashboard isn’t complete until it highlights the accumulated drawdown and schedule- mapping out how much goes where, when, and why. Show LPs exactly how proceeds will flow- to them, to GPs, and toward fees. In other words, make every cent’s journey transparent and undeniable.
Fund Summary & GP
No Fluff, Just Full Transparency
Not every fund model lays this out. Some gloss over it, others hide it completely- but we’re firm believers in radical transparency with LPs.
As the name suggests, your Fund Summary is the no-BS breakdown of everything that matters:
Closing fees
Drawdowns
LP commitments
Late admissions
And, most importantly, how the fund operates behind the scenes.
Once you’ve laid that out, you segregate the numbers:
📌 Organization & partnership expenses
📌 Management fees (the real deal-breaker for LPs)
This isn’t just a table of numbers- it’s a trust-building tool.
You Have To Show LPs Where Every Penny Goes
Let’s be real: LPs will ask where the management fee is going. And if you can’t answer that convincingly? You’re in trouble.
So, be upfront. Show them:
✅ No, you’re not blowing cash on lavish parties.
✅ No, you’re not handing out outrageous salaries.
✅ Yes, your team is lean, strategic, and built for scale.
LPs know that managing a 50-company portfolio isn’t a one-person job. This is where you prove you’ve built the right team- or risk looking like a one-man show they won’t bet on. You either demonstrate a well-structured team model or expect them to call you out.
Get Granular (yes, again!)- Because LPs Will
We’ve been hammering the importance of granularity for a reason. This is where it really pays off. Break. Everything. Down.
🔹 software, HR, accounting, legal, ESG and every other operational cost you can possibly think of.
Show them you’ve thought of everything and that no expense is unaccounted for.
The takeaway? Think hard. Run the numbers. Know exactly how much you need to make this fund work at a minimum viable level.
Because if you don’t? Your credibility is out the window.
Fund Return Potential: Time, Growth & Probabilities
We’ve already covered timelines, variables, and risk factors, but here, you quantify it all.
This is where you model how an asset develops over time, translating all your strategic decisions into real return probabilities.
Closing the Loop: Completing Your Fund Model
Once your Assumption Sheet is rock-solid, everything else clicks into place. This is where you compile all your data, refine your final calculations and feed everything into your dashboard.
It’s also where the most satisfaction comes in as you watch the blocks come together by feeding each other and feeding from the assumption sheet.
If you don’t nail this, it’s like trying to finish a puzzle with the last piece missing- no matter how great the rest looks, it just won’t come together.
Get this right, and everything else falls into place.
Stay tuned for part IV, where we’ll dive deep into the last three building blocks.
Ready to take your fund modeling to the next level? Join the EUVC Community that offers an exclusive experience tailored for VCs and learn more about fund modeling from our learning sessions on:
Essential building blocks
Assumption sheet construction
Portfolio construction & decomposition


